
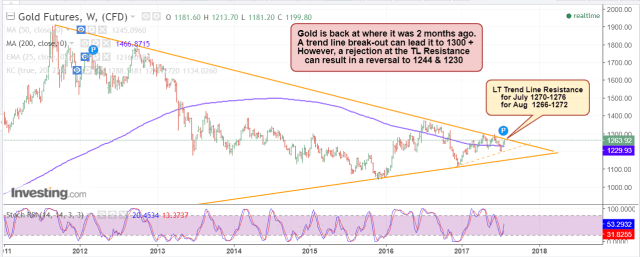
The Golden triangle chart I posted on StockTwits in Dec 2016 has remained in tact so far (see charts below). After hitting close to 1300 in May 2017 & then dropping to 1203, Gold has recovered nicely most of its recent losses and is back at where it was in May ’17. Two break out attempts above the TL Res this year have failed and now Gold is now making its third attempt to breakout. While a clear break above the trend line can take it to 1300 and beyond, a reversal at the resistance might lead it down to 1244 & 1230 (currently the 50 Week MA & the 200 Week MA)
Current chart:
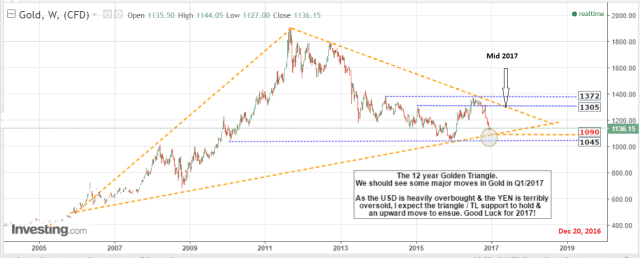
The Golden Triangle Chart from Dec 2016

Pingback: Gold Update | Crystalballing with Venkat