DOW and S&P (q1/q2 2019)

Hope you guys enjoyed my previous post on S&P 500. Looks like the markets set out in Jan just to make my mind waver on my 2019 forecast.. But no, I am not changing my mind or my bearish forecast.

The much needed relief rally has come through, thanks to the Fed Chair Mr Powell’s dovish statements on Jan 4. Subsequently fueled by the prospect of a resolution to the US-China trade war, this rally / spike has been bigger than what any one would have thought of..

However, after what happened with AAPL a few weeks ago (lowered guidance for iPhones and the problems in China market), and the negative outlook developing for autos, retail and a few other sectors as evidenced by the 2019 guidance released by some companies, I have more conviction about the return of the bearish trend that started in Oct 2018. And this is despite the fact that markets have registered a mind-boggling 8 week run from the Dec lows with the indices notching up a 10-12% gain in Jan 2019 alone. Here is my forecast for the DOW for the next 4 – 6 months.

Dow weekly Feb 15 2019

S&P and DOW:

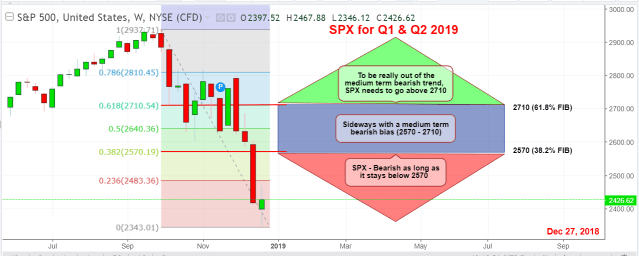
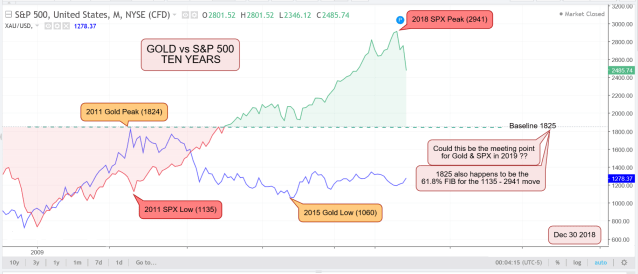
While an “extreme target” for the S&P 500 would be 1825 (as explained in the previous post), I do think that a moderate target of 2300 -2400 still has a great possibility of being met mid-year. My confidence level on this target is no doubt down a bit since S&P closed last week above the critical 2720 levels but it is not fully gone.

For 1825 to happen, markets have to crash and for that to trigger, we need more confirmatory signals on a 2019 recession + escalation of trade wars (please don’t get me wrong, I don’t wish for either event). However, 2300 – 2400 for the S&P and 21600 -22000 for the DOW still look quite feasible in my perspective.. The million dollar question is – will the markets turn around right now or only after pushing to new highs that take SPX to 3000 and DOW beyond 27000? And will we start seeing an Earnings recession in Q2 or Q3?

There seem to be enough signals from the charts, as well as from fundamentals (retail sales data for Q4, lower guidance from any companies for 2019, and revision of the Q1 GDP forecast from 2.17% to 1.08% by the NY Fed, to name a few) and most importantly from the Fed outlook itself that can lead us to those targets.

Sample this and tell me how conflicting this one is: We have a “very strong” economy but this economy CAN NOT tolerate a 2.5 to 3% interest rate so Fed has to turn dovish all of a sudden? smh!

So here are my targets for Q2/Q3 2019:

DJI (DOW Jones): 23350 (moderate), 21600 (aggressive)

SPX (S&P 500): 2350 – 2400 (moderate), 2050 & 1825 (aggressive)

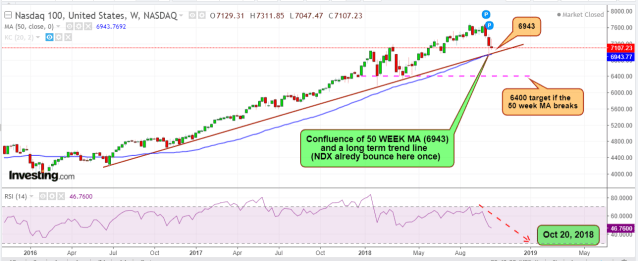
NDX (Nasdaq 100): 6400 – 6500 (moderate), 5800 (aggressive)

GOLD: 1500 – 1550

**Aggressive targets : valid if more recessionary signals show up in the next few weeks

Now here is another interesting fact:  The status of some major stocks after the mind-boggling 8 week rally! (status as of Feb 13, 2019):photo

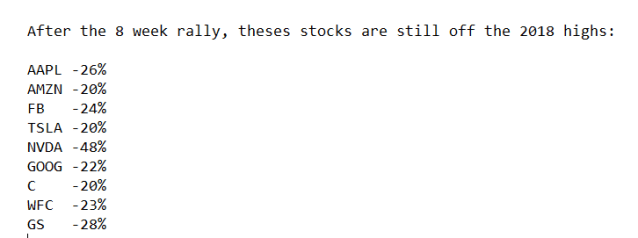
It is one thing to have bought the Dec lows (kudos if you did) but to be long at the current levels or to be buying at current levels after a 18% rally in 8 weeks does not seem wise to me. So folks, wake me up when the bull market is really back (that is, if & when indices start to register new all-time-highs)

Posted in charts, Economy, forecast, Gold, stocks, Uncategorized | Tagged , , , , , , , , , , , , , , , , , | Leave a comment

Q1 & Q2 2019 – where is SPX going?

A very happy New Year to all!

Our market forecast for Q4/2018 was a great success and we met most goals for the indices as well as many individual stocks (some of these forecasts can be found in the Oct/Nov/Dec archives). In fact, SPY and QQQ exceeded our (bearish) forecast targets.

Here is my macro view on the S&P 500 for the first two quarters of 2019:

  1. On Dec 31, 2018, SPX and DOW closed below the 2018 Feb lows. This is uber bearish purely from a technical stand point.
  2. Markets might attempt multiple bounces but a sustained rally might be hard to come by, unless there is a satisfactory conclusion to the trade tariff  battle with China.
  3. Over the next 2 quarters, despite bounces that are very likely, I expect the market trend to remain mostly bearish (I attach 80% probability to this).  I do expect the GDP growth to start declining from Q2 of 2019 due to trade barriers and political upheavals, leading to more stock market upsets in 2019. While the numbers on the economy & jobs have been good so far, one should start paying close attention to the housing sector & the declining home prices besides the burgeoning trade deficits & Govt debt.
  4. For the bulls to gain back control and take the markets to new highs, they would need to push SPX above 2710 at the least. And that scenario right now is not looking pretty. So I would put the chances of a bull market for 2019 at only 20%.

Here is a chart representation of this macro-view:

SPX Macro view Dec 27 2018

More thoughts for 2019 as a whole (these are just some possibilities, NOT predictions):

1. Fed might raise rates once more or may not raise at all in 2019

2. Fed might start cutting rates in late 2019 and we might see at least 1 rate cut before the year ends.

3. GDP growth might start slowing down from Q2.

4. After some initial weakness, Dollar might gain some strength over all the currencies except the Yen. Yen to gain even more strength.

5. An extreme possibility is SPX and Gold reaching a “meeting point” as detailed below.

Gold and SPX:

Given below is my baseline thought for SPX and Gold in the event my fears about Q1 and Q2 come true and signs of a recession start appearing by Q2.  I will need more inputs over the next 8-12 weeks to validate this thought and convert it into a “forecast”.

According to this baseline theory, there is a possibility that SPX (currently at 2485) and Gold (currently at 1278) could find a meeting point somewhere in the 1725 – 1925 zone.

Gold vs SPX Dec 30 2018.PNG

Sounds impossible? Sounds unreal? Sounds ridiculous? Yes to all. That is why I call it as an “extreme possibility”.

But let me ask: in April 2008 when SPX was at 1400, how many of us expected it to tank to 660 by March 2009? And more recently, how many of us thought that SPX would crash below 2400 in December?

As far as Gold is concerned, it had lost its sheen over the last few years thanks to the ZIRP + low interest rate policy, continued bullishness in stocks and the crypto boom. With the crypto boom fizzling out and stocks losing heavily, I feel the time has come for Gold to re-acquire its lost sheen. And if and when market fear turns into panic, Gold could sprint at double the pace.  My target for Gold in 2019 is 1500 – 1550 (with a lack-luster GDP but no recession) and in the event we get a confirmation of recessionary signals, then another $200 shouldn’t be a stretch for Gold.

Please feel free to comment / share. Thank you!


Posted in bitcoin, charts, crypto, Economy, forecast, Forex, Gold, JPY, stocks, Uncategorized | Tagged , , , , , , , , , , , , , , , , , | 1 Comment

Winning with Forecast charts- SPY & QQQ

Not much needs to be said. A read-through of the previous post (with Sep / Oct forecasts) lays out how extremely simple charts once again helped us win gold during this quarter (after a similar run in Q1 / 2018).

Check out the charts – especially the QQQ, NDX and SPY charts (and the XLF chart which I used as the Lead indicator) under this post:

Will try & release the Q1/2019 forecast in the first / second week of Jan.

Happy Holidays and a wonderful New Year!

Posted in charts, Economy, forecast, stocks, Uncategorized | Tagged , , , , , , , , , , , , , , , , , | Leave a comment

Markets: Some key charts / forecasts from Sep, Oct and Nov 2018

The markets have certainly turned medium term bearish, and the bearishness has accelerated since the mid-terms as the US-China trade deal remains elusive (no surprises here though). I am still betting on SPY 255 and QQQ 152 to be reached before Dec 15. Following are some of the key charts / forecasts that I had posted on StockTwits / Twitter over the last 2 months:

Though I have been bearish since mid-September, this XLF chart was the most important one (Banking & Financials which probably remains the Lead indicator for the markets) that helped me conclude with conviction that the markets were really in for a deep correction over the medium term, despite the booming US economy. The technical positioning of QQQ along with AMZN and AAPL further helped confirm my bearish theory for Oct – Dec.

XLF – Critical Bearish Alert (posted on Oct 12):XLF Oct 12 2018.PNG

QQQ – Bearish Chart (Oct 10)  with a forecast update on Oct 20QQQ Oct 10, 2018

NDX – chart from Oct 20. A target of 6400 was set “if the 50 WEEK MA broke”ndx Oct 20 2018

AAPL – Sept forecast for a drop to the 50 DMA and possibly to the 200 DMAAAPL Sep 10

AMZN – I had forecast the possibility of a parabola break in July 2018 (click here for the forecast). On Oct 10, the break was confirmed and targets were set as below. So far, we have met only the first target (1448) but I do expect target 2 to be met by the end of the year. AMZN Oct 10 2018

AMD – a parabola break was in the offing . Here is the chart dated Sep 18 with forecast targets. The targets were exceeded in this case as AMD dropped to a low of 17.AMD Sep 18 2018

SQ – Another parabola break was in and targets were set (Oct 16)SQ Oct 16 2018

XBI – Oct 24 chart (XBI tested the target zone of 74-75 in Nov)XBI Oct 24 2018

SPY – Forecast dated Nov 7. From the Nov 7 level of 281, the target of 265 was met on Nov 19 – in just 10 trading sessions!SPY Nov 7 2018

QQQ – expecting the 155 level to be taken out soon. The low so far: 157QQQ Nov 7 2018.PNG

QQQ – Phase 1, 2 and 3. Should lead all the way to 155 and possibly 152QQQ mid Nov 2018.PNG

NFLX – updated chart dt Nov 18. The last target (213) from 400 level is still pending. Expecting it to be hit before Jan 31, 2019NFLX Nov 19, 2018

NVDA – chart dated Nov 19. Another parabola that broke. Expecting 128 to be met in Dec/JanNVDA Nov 19 2018.PNG

And finally, looking for FB to meet its fate (115) very soon.FB Nov 19 2018.PNG


Posted in charts, Economy, stocks, Uncategorized | Tagged , , , , , , , , , , , , , | Leave a comment

Crypto Portfolio Update (Nov 25, 2018)

Well, all is obviously not well in the crypto world. BTC and other coins have been crashing and the crypto bearishness has been accelerating ever since BTC broke the critical 5500 mark. Did not bode well for my portfolio but then, what are Stop Losses for? One should be always thankful for the Stops.

So, here we go once more as more seeds of doubts about Bitcoin and cryptos in general are being sown. One thing is clear – unless Bitcoin, the leader turns around, no other crypto is going to see the light of the day.

Overnight, BTC crashed below 4000 and for now looks set to test the 2500-2700 level. I am glad I stuck to my views on BTC and did not buy again as it did not go above my buy threshold of 6800. 

Since the last update on Nov 5, I exited BCH (lost $600 on 5 BCH) and XLM (lost $750 on 10000 XLM), as my pre-determined Stops were hit. Now I am left with only XRP.  Since XRP is the only one remaining in the portfolio I am removing the Stop on it (it can still go to zero but I can afford to take that risk for now). So my portfolio looks like this as of Nov 25 morning:

5,000 XRP @0.48                    2,400           (CMV at 36c = 1,800)

Cash                                           10,370

Total                                           12,770           (original investment: $15,000 in Jan 2018)

On the day I started this portfolio in mid-Jan 2018, BTC was at 11,000 and XRP was at 1.15. As representative samples, they have dropped by 65% and 69% respectively from those levels in 10 months. Thanks to the Stop Losses (and some profit bookings), my portfolio in comparison has seen only an erosion of 19%. Not bad but it is still an erosion. I will however look to build the portfolio again when BTC drops below 3000 (note I am not saying “if” but “when”). That may be the time to buy again. Till then, putting the portfolio to sleep.

Click here for the previous update (Nov 5, 2018)

Posted in bitcoin, crypto, Economy, Uncategorized | Tagged , , , , , , , , | Leave a comment

Crypto Portfolio Update (Nov 5)

Though Bitcoin is still languishing below the 6500 levels, the alt-coins have finally started moving above the critical levels mentioned in the previous update (Oct 4) and thus triggered the following long positions. On Bitcoin, I am still waiting – it has to clear the 6700 level for me to get in with some conviction.

BCH – bought 5 at 520, as it jumped above the trigger level of 500 (Nov 4)

XRP – bought 5000 at 0.48 as it cleared the trigger of 47c (Nov 4)

XLM – added 5000 at 0.25 as it cleared the trigger of 24c (Nov 5)

Here is the updated status of the portfolio as of Nov 5, 2018:

5000 XLM @ 0.20                1,000         (old lot) (Stop Loss 15c. Target: 40c)

5000 XLM @ 0.25                1,250         (Stop Loss 15c, Target: 40c)

5000 XRP @ 0.48                2,400         (Stop Loss 35c, Target: open)

5 BCH @ 520                         2,600         (Stop Loss 400, Target: open)

Cash                                         6,870         (pending BTC buy when it jumps >6700)

TOTAL                                    14,120         (Original investment was $15,000 in Jan 2018)

Click here for the previous update (Oct 14, 2018)

Posted in bitcoin, charts, crypto, Economy, Uncategorized | Tagged , , , , , , , , | Leave a comment

Crypto Portfolio Update (Oct 14, 2018)

No change to the portfolio since the previous update (it is a big feat that I have managed to avoid the temptations to buy, for more than 2 months now!). I am still hesitant to buy any of my favorites as the signals are still unclear. The other reason is that Bitcoin volatility has died down quite a bit in the last few weeks and so it may make sense to buy it on strength rather than trying to pick a bottom. So here it is:

BTC: Tech indicators currently appear neutral. The 50 DMA is around 6620. Hence, will buy only if it clears the 6650 – 6700 zone.

BCH: Watching the price closely. Will be buying if it jumps above 500.

XRP: Will buy if it clears the Keltner resistance at 0.47. And will possibly add more if it clears the 200 DMA (currently 52c) with aplomb.

XLM: This is the only token that currently exists in my portfolio. The Stop for the current position is 15c. I would certainly like to add more XLM but only if it clears 24c.

Portfolio status as of Oct 14, 2018: 

5000 XLM @ 0.20                1,000         (Stop Loss 15c. Target: 40C)

Cash                                        13,120

TOTAL                                    14,120          (Original investment was $15,000 in Jan 2018)

Click here for the previous update (Sep 15, 2018)

Posted in bitcoin, charts, crypto, Economy, Uncategorized | Tagged , , , , , , , , , | Leave a comment

Fanaticism, Blurred reality and Risk Management

Posted in charts, crypto, Forex, Gold, stocks, Uncategorized | Tagged , , , , , , , , , | Leave a comment

Crypto Portfolio Update (Sep 15 2018)

One should be always thankful for the Stop Losses. They did save me again this time when Bitcoin and other tokens got whacked.  I got stopped out of Bitcoin at 6400 and Bitcoin Cash at 520 as the Stop Losses triggered. (Click here for the previous update from Sep 1)

Since then, I haven’t bought back BTC or BCH though Bitcoin is now back above 6400.  As a result, only XLM is still in the portfolio and rest all is in cash.

I expect another dip this month for BTC and the other cryptos before they consolidate and move up again. I am going to basically wait for that dip to re-enter. I have no entry targets right now for BTC and BCH but when the charts give out signals, I will post my thoughts here and on Twitter / StockTwits.

Click here for the Sep 1 update

Click here for the July 29 update

Click here to learn “Trading Strategies & Risk Management”


Posted in bitcoin, charts, crypto, Economy, stocks, Uncategorized | Tagged , , , , , | Leave a comment

Flourish Alerts – today is our First Anniversary!

Hello folks,

I am extremely pleased to report that today (Sep 14, 2018) we are completing one year since the official launch of Flourish Alerts. Many thanks to our supporters and patrons without whom this would not have been possible.

We have had our share of success and failures over the last 12 months but overall, the performance has been generally good to great except for a couple of bad months. As I always say, the focus is not on winning all the trades (which is impossible given the market-risks we face everyday) but on winning a majority of trades and to consistently win more than we lose by adapting proper trading techniques and risk management.

Flourish Alerts is open to new subscribers now. You can find more details here or write to me at: flourish.alerts@gmail.com for details.

Training on Risk Management:

On this wonderful occasion, I am also pleased to announce that the next 2 batches of classes (online, live) for the training program on “Trading Strategies and Risk Management” will be held in October 2018. You can register here for the programs.

In case you would like to learn this program at your own pace, a video-based training curriculum is also available (at a lower price). Please write to me at: flourish.alerts@gmail.com if interested.

At Flourish Alerts, we look forward to another great year. Happy Trading!!

Posted in bitcoin, charts, crypto, Economy, Forex, Gold, Natural Gas, Oil, stocks, Uncategorized | Tagged , , , , , , | Leave a comment