
Here are some of the crypto charts / forecasts I posted recently on StockTwits (Handle @Flourish) & Twitter (Handle: @Flourish_Venkat)
So far, things have moved according to expectations though further selling pressure is needed to meet the final targets. All the forecasts are looking good so far but I don’t want to get carried away. Knowing cryptos, they can anytime turn around and spike up. The good thing is I am not short and rather I am waiting with entry targets to buy on dips)
Ethereum (ETH) – I think we won with this parabolic chart by getting out of ETH at the right time. Now the latest weekly candle is jamming against the parabolic curve. A break below the curve is inevitable & bearish. (I will review ETH again if it gets below 900).
My post / chart dated Jan 10 2018
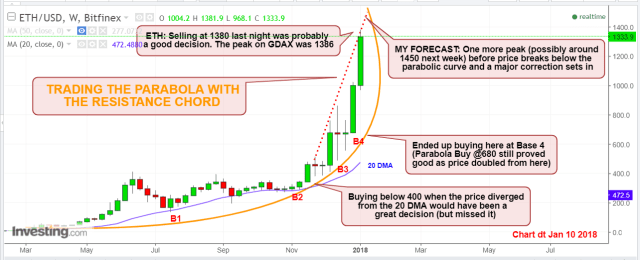
Today’s chart (Price is set to drop below the parabolic curve. 1425 current High)

ZCASH (ZEC) – was expecting that trend line break (630 level) this morning. And that has happened now!! Target zone remains at 530-550

RIPPLE (XRP) – Another day, another drop for Ripple (my favorite crypto). Here is the post / chart from Jan 10 again.
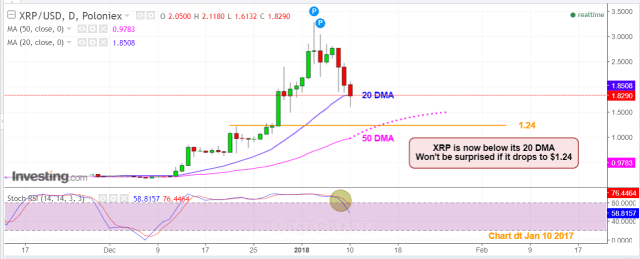
And this is the current chart update (posted today on Twitter). The 50 DMA moved up and we are getting close to the target buy zone.

Happy Trading!
What about the leader, Bitcoin? Click here for the latest forecast
