
It is good to keep things simple. Do simple charts always work? Not always but mostly they do… well, provided you have a pair of night vision glasses.
Permabulls, Fund Managers & professional chartists alike didn’t see this market drop coming. Though the economic activity had picked up and the companies have been reporting solid growth on a consistent basis, I was left wondering why these folks weren’t seeing (a) the overvaluation of stocks and (b) the political & administrative troubles in Washington DC as major deterrents to further stock market valuations.
In Jan & early Feb 2018, I observed from Twitter & StockTwits forums, the market participants were bombarded with extremely bullish charts – some simple charts, many looking very complicated (Some folks do believe that unless you make a complicated looking chart, you are not an “expert” chartist:))).
It is true that you can infer a lot from reading a chart but as I always say “you only hear opinions but not the facts, and you hear ONLY perspectives but not the truth” (that applies to my opinions and forecasts too). No chart is 100% conclusive and you can have different views based on different technical indicators – that is why keeping the charts simple and neat assumes great significance. But what is more important is the ability to forecast even before a trend cycle is complete & even before a technical indicator gives you confirmed signals (the difference between a technical trader and a smart-tech trader)
Coming to the point, the ratio of bullish:bearish charts was something like 100:1, with every one calling for new highs. It looked like bears were almost extinct. My contrarian views on the SPX and DOW were:
“not going to see a new high for a few months, not unless we see a major correction”
“while the LT trend may appear bullish, short term trend is clearly set for bearishness”
AND lastly,
“after 8 years of Buy the Dips, it is now time to change the theme to Sell the Rips”.
While I did believe that the markets were going to be long term bullish, I felt strongly there was a very big short term opportunity for the bears, with the possibility of a 15-20% correction before the market pulled itself up. Even after President trump indicated he was going to consider tariffs, the perma-bulls were relentless in their calls for new ATHs. But last week, my belief was vindicated to a great extent as the indices tumbled once again, close enough to the Feb lows. (It is not over yet though we may see some short term oversold bounces).
Here is the Statement from Feb 12 on markets:
“In my view, the spine of the markets was broken last week and that has absolutely changed the market trend to bearish (not the Long Term trend but the Short Term trend). Blame it on the new Fed chair, inflation, past euphoria, rate hike optimism, politics or profit taking (or the bluemoon-bloodmoon-lunar eclipse) those two days of 1000+ point drops on DOW had certainly shaken the market and changed the market perception.
I expect very big swings & high volatility to continue in February and March and I do not expect a new ATH any time soon as recovering from the lows (and the forecast lows as above) is going to take a lot of time. Having said that, one doesn’t have to be a perma-bear. Though I expect the market to be overall bearish for the next few weeks, it will provide huge enough swings for smart traders to play both ways, especially with volatile stocks. Happy Trading!”
(Click here for the full Feb 12 article)
Here I present below some of those simple charts I published since Jan (all of them were posted to Twitter and/or StockTwits on the respective dates):
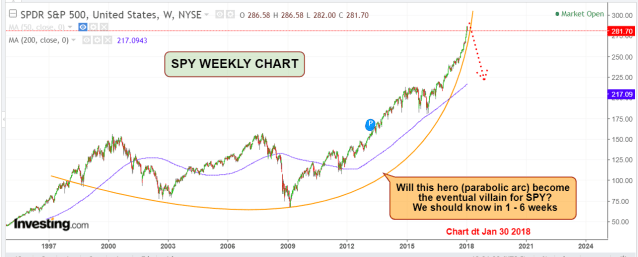
SPY – Jan 30 (and SPY did fall, breaking the arc within a week)
SPY – Mar 2 (SPY Daily chart – the broken spine and why I believed it was hard to fix)


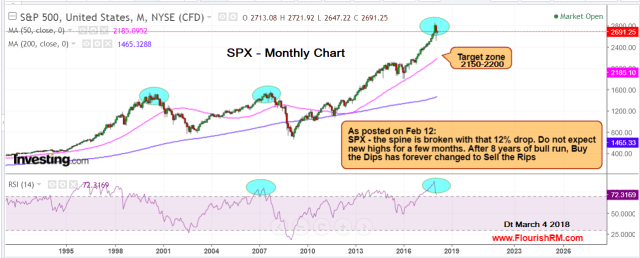
SPX – Mar 4 – The REAL big one for SPX (reversal on the Monthly chart – finally!!)
Decent Correction due. Targets the 50 MONTH MA which is the 2150-2200 zone. (Whether the RSI extremes on the daily & weekly charts worked or not (they haven’t for a while now), I believe the Monthly extremes would certainly work.
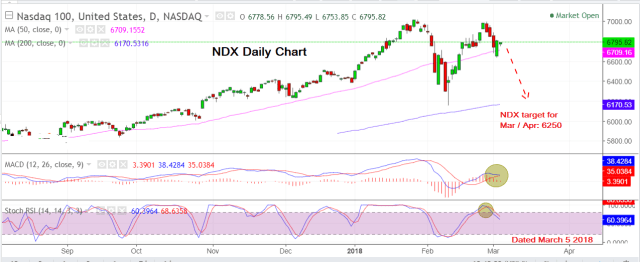
NDX Daily Chart – Mar 5 (Though the stochastics / RSI indicated a reversal was due, this was not a sure-shot thing, especially when MACD was yet to turn bearish. However, considering how bearish SPX was turning out to be and the effect it can eventually have on Nasdaq, I couldn’t resist forecasting a fall for NDX – the target being the 200 DMA).
Though SPX couldn’t reach new highs, NDX registered a new high but had to eventually follow SPX and DOW. Now it has fallen 10% from the recent highs and is just 4% away from my target of 6250
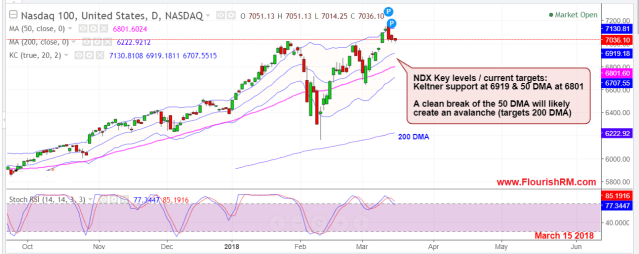
NDX – follow-up chart on March 15
SMH – March 14 (another simplest of charts that worked beautifully). I depended only on a couple of momentum indicators and the stock has already hit / exceeded the 50 DMA target projected.. If it doesn’t recover soon, I wonder if the 200 DMA will become a potential target.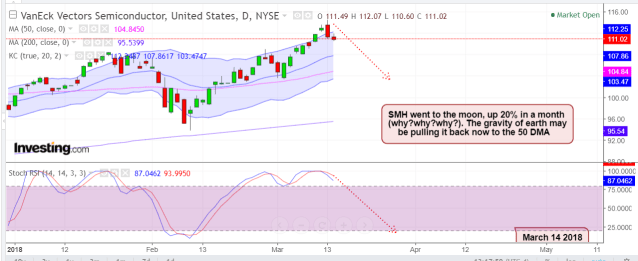
IWM March 15

IWM Marh 22

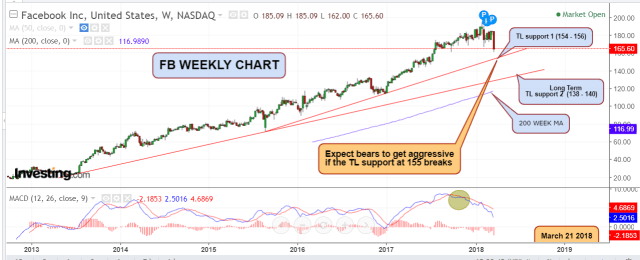
FB – Mar 22 chart – I have been bearish from 180+ levels though in this case Cambridge Analytica news turned out to be a good catalyst for the drop. Now targeting 140 & 120 zones if the TL support at 155 breaks. (Focus: the broken MACD on the weekly)
NFLX – as posted to Stocktwits on March 13 with Targets 300 & 275 (did not post the chart but the daily and weekly were heavily overbought. 275 was the 50 DMA then)

What to expect for April:
There could be some bounce in the last week of March, considering that the quarter end is approaching. But I think the correction is not over yet and I expect any bounce to be short lived. If SPY breaks the Feb lows (it is very close) and NDX fails to find support at the 200 DMA, we can expect bigger drops in the tech stocks in April – notably in FB, TSLA, NFLX, AMZN, GOOG, NVDA, BKNG, AVGO, INTC, MU and QCOM. Of course that means SMH & QQQ will be in further trouble too!
HAPPY TRADING with “Sell (or short) the Rips” as the theme for another month or two!!
