
Here are a few interesting charts that I had posted on Twitter & StockTwits during early August:
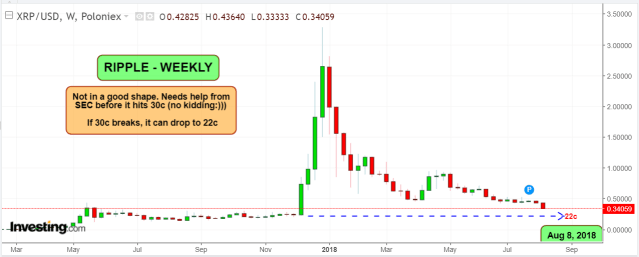
Ripple XRP (Aug 8 chart): And you know where it exactly went!! (below 22 cents)
Ethereum ETH (Aug 8 chart): “Expect $100 drop” & ETH dropped 102 to hit a low of 257

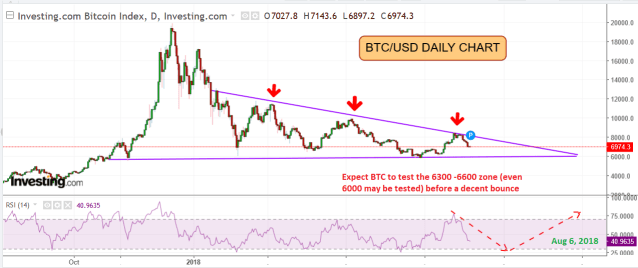
Bitcoin BTC (Aug 7 chart): Went from 7000 to the “potential 6000” and then bounced. Now waiting to see if it can break above the upper Trend Line Resistance
Semi-conductors SMH (Aug 7 chart). It is getting close to that trend line Resistance now

AVGO (Aug 7 chart): Hanging in there. I still have a high conviction on that 160 target

TWTR (Aug 8 chart): Bearish as long as it stays below 36.

BABA (Aug 8 chart): Did touch the 165-166 support zone as expected and then bounced to 180. Now we can expect another test of 166 if the tariff talks with China end in stalemate.

TSLA (Aug 7 chart): Broke above 360 only because of that popular (or notorious?) “Funding Secured” tweet but now it has broken below the 50 WEEK MA and even below $300 (currently down 23% from the post-tweet high of 387).
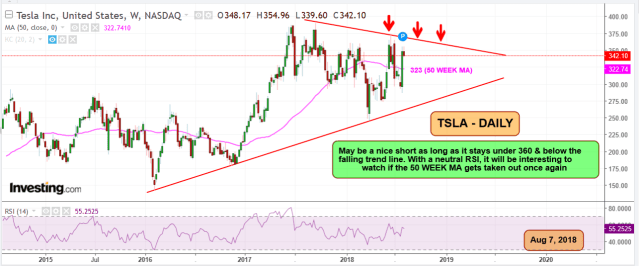
Current forecast for TSLA: Still bearish.. Could test the 265-270 zone very soon (see the Aug 30 chart below) and if the trend line breaks, possibly will go to 220-240

