WTI still trending sideways

Despite the OPEC output cuts (promises?), various supply disruptions in the Gulf & the worsening situation in Venezuela, WTI hasn’t been able to break out of the 14 month sideways range (42-52).

Now come the effects of Hurricane Harvey and the US sanctions on Venezuela. Can these two factors really push WTI out of the range, upwards? I highly doubt it. I expect the effects of both to dissipate soon and WTI to keep trading in the established range (just like how the the recent drop in Libya output was ignored by the Oil markets).

WTI Aug 27-1

Long Term traders are looking for a breakout one way or the other but the fact that it has stayed within the range despite all the adverse news (such adverse news being positive for Oil) tells us if & when the breakout happens, it is more likely to be a bearish breakout than a bullish one.

While one strategy is to wait for a breakout (up or down) and then take a medium term position, another good strategy may be to fade every spike within the range as long as the range top is not violated.

Short term trading: The 200 DMA at 49.64 might be a good Resistance for this week despite all the adverse news. However, if WTI breaks that resistance and runs above 50, I will be adding to my short positions in the 51-52 region. My near term targets continue to be 45, 42 & eventually 39.

WTI Aug 27-2

Posted in Oil, Uncategorized | Tagged , , , , , | Leave a comment

Trading the Risks

All of us know that markets carry high uncertainty & risks. Despite that we are all here to win. However, trading is not about being right all the time but about maximizing your wins, cutting your losses & maximizing your overall returns with 3 things –

(a) Adapting a proper trading strategy

(b) Formulating a trade plan that has the right set-up &  an ideal Risk-Reward element

(c) Exercising discipline with Risk Management techniques

If these 3 basic things are taken care of, you can be a winner. I lose 3 out of 10 trades on an average. But when I win, I win big. When I lose, I lose small. But how? Just by adapting a rule based trading system that covers all the three elements listed above.

If you want to learn more about the system I use or about Trading Strategies or about Risk-Managing your trades, please click here 


Posted in Uncategorized | Leave a comment

WTI Crude & Nat Gas – Long Term trends & Critical Levels

Natural gas may be warming up, in anticipation of warmer temperatures. NG’s price trend seems to be in that typical 24-26 month cycle which we have seen from 2010. We are probably in that 2 year bullish trend that started in early 2016, after those abysmal lows we saw in 2015. Also, NG may be nearing a major milestone soon – the 50 month moving average. A break above that critical level could help NG run up a bit before we start hearing preliminary winter forecasts that could define the next phase. Here is a LT chart for NG. While 4.50 seems possible by the year end based on this LT chart & prior cyclical trends, another drop to the 2.80/2.85 levels cannot be ruled out based on short term charts.

NG Aug 21 -2

Crude, on the other hand is still in the long term bearish trend that developed ever since it dropped from the lofty 150 levels. Nothing much has changed in terms of trend-based technicals though OPEC has been trying its best to fight the glut with some action (in terms of output cuts) and words but markets are not really enthused. With every recent monthly report showing increased production from OPEC, markets have lost hopes on a concerted action from OPEC as SA seems to be the only one trying to keep up the promise of cuts. As forecast by many in early 2017,  WTI crude has stuck to the range of 40-55 so far. Now we have another major thing happening on the LT charts.

Take a look at the chart below – the 50 month MA is about to cross below the 200 month MA. Though MAs are lagging indicators, this cross over could overshadow the charts for a few more months at the least. And the Resistance at the 25 day EMA (orange line) & the prior high of 55 might be able to keep the bulls restrained for some time. The short term trend line is broken and points to more trouble ahead for WTI.

WTI LT Aug 2017

So I would stick with the earlier bearish forecasts with targets of 42 & 39 for the Fall, as long as the problems in Venezuela do not force the US or other countries to impose sanctions or an oil embargo on Venezuela. (WTI is once again running above 48 as I write this, probably in anticipation of those sanctions to be announced soon).  If the 50 MA / 200 MA cross happens (we will know that in a month or two), and the Venezuela stuff ends in some compromise & not an embargo, then we may be really looking at 33-35 by the end of the year / early 2018. Didn’t Trump say he wanted cheap oil? Venezuela will be a test for him now.


Posted in Uncategorized | Tagged , , , , , , , , | 1 Comment

How to manage risks related to your trading?

Losing money consistently on your trades? Want to master the art of risk management & become a winning trader? 

Click here. Classes start on Aug 17. Today is the last day to register!


Stock markets & Forex markets by their nature, are risky. They can be unkind & treacherous. When you start trading, you start with a disadvantage – be it the broker commission or the bid-ask spread that you see every day eating into your capital. Besides that there is the market risk. So what do successful traders & professional traders focus on as an important trait? It is the Risk Management element – for them, no trade plan or strategy is complete without Risk Management.

Stop losses are a popular way of limiting your risk. To succeed, one needs to identify & use the right (and reasonable) stop loss levels.  Otherwise one can run the risk of stop losses triggering all the time. But keeping a Stop Loss alone is not Risk Management. There is much more to risk management than what is commonly known. The application of the technique needs further study & understanding.

If you are interested in understanding the concept & how to effectively use it to become a successful trader, please click here for an online program on Risk Management. 

Posted in Uncategorized | Leave a comment

Further update on NVDA


As expected, excellent results by NVDA, beating handsomely on all fronts. And as expected, the price has fallen after hours from a high of 174 to 153.  In the process, the 50 DMA has been decisively broken. A lot of folks have been wondering why such things happen – a 12% fall from highs despite a handsome beat and a good outlook.

As I have tried to explain before, markets work on sentiments. NVDA has seen a quadruple jump in its stock price in 14 months – which by itself is phenomenal – but then it has taken the stock to very high valuations in quick time. It has the potential to reach 250 or more but then it has to take a pause, have a healthy correction before it can build on recent gains. There is lot of expectation play, sentiment play, contrarian play and technical play involved in a stock like this. Also, think about the people who got in at 40 and 80 or at 120 in the recent past. When do they sell? Think about insiders. When do they sell? Everyone is not going to keep the stock for retirement or for their yet-to-be-born grand children!

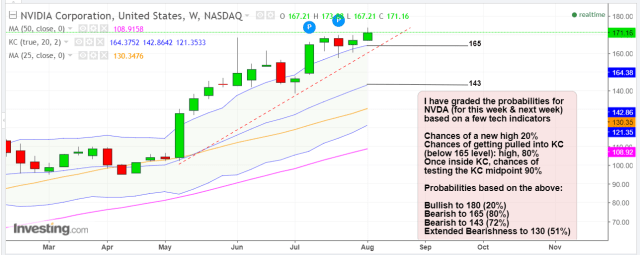
Now that the 50 DMA is broken,  NVDA is getting possibly bearish for the short term. One of our targets was 143 with a 72% probability. (You can read the earlier article and price probability forecast from Aug 8 below this post).

As mentioned in the prior article, NVDA stock was sitting atop the weekly Keltner Channel and I expected the price to be pulled down into the Channel despite what the results were going to be. (If the ER had surprised to the bad side, I bet NVDA would have probably dropped to 130 or below by now). Typically, when such a pull into the channel occurs, and if the stock is already in overbought territory, it indicates sellers may emerge with force and push it down further. The channel’s midpoint becomes a potential support level where buyers would emerge again. Now this midpoint support as on the day of my earlier posting happened to be at 143 (on weekly chart).  And today’s LOD around 165 happened to be the same channel support point but on the daily chart.

Now that the ER euphoria is over, let us take a look at what is in store next. In my view, NVDA remains weak for now. It still has a high potential for growth and is LT bullish. However, for the next few weeks, we may see this correction getting steeper, unless NVDA recovers on Friday & sets up a weekly close above the 50 DMA again.

The potential targets are – the weekly Keltner support at 142 (it could become 139/140 as the price falls & the channel slopes down) and by extension, the 100 day moving average (currently at 135). These two targets are derived from two different charts – one is a weekly chart, the other is a daily chart. Here they are:

NVDA weekly


NVDA Daily

Key take-aways:

  1. Solid management, solid performance, solid growth, LT bullish. Nevertheless, NVDA is exhibiting short term weakness. Hence some more correction may be due, according to my PP analysis
  2. A decisive Weekly close below the 50 DMA will provide a  bearish confirmation. For that confirmation, we need a close below 157 this Friday and in such an event, we will very likely see the price dropping to 140 levels before further rise.
  3. However, if the stock closes above 157 this week, it might recover from bearishness but in that case, I would expect it to trade in the 152-172 range for the next one quarter.


Posted in Uncategorized | Tagged , , , | Leave a comment

NVDA – great on fundamentals, not so great on technicals

NVDA deserves all the accolades, no doubt. Great company, great management, great products, awesome growth. But I take the  current price with a pinch of salt..

No questions about its fundamentals but a quadrupling of stock price in 14 months)? Something is not right..

Here is is my probability forecast purely based on a few momentum oscillators (on multiple time frames) and the current unwarranted euphoria on this stock.. From 170 levels, 200 is a possibility but 140 seems more likely to me. The ER is on Aug 10 and the bulls may be in for a near term shock. Bull or Bear, make sure you have a Stop Loss in place.. Happy trading!!

NVDA Aug 8

No one is happy to lose. Become a successful trader by learning the art & science of Risk Management the right way! Click here for more

Posted in Uncategorized | Tagged , , , | Leave a comment

WTI – the small pennant & the big wedge

On Aug 7, I posted a WTI chart on StockTwits – basically a bullish pennant based on which my expectation was for a continuation of the current run up. However, I do not expect WTI to run beyond 52/53 for now as the LT outlook continues to be bearish both on fundamentals and technicals.

In today’s chart, I have attempted to “size up” the potential trend zones as I thought this would help us to some extent, going forward. Here, my goal was to present a larger picture. The focus is not on that small bullish pennant, but on the larger wedge and a medium to long term outlook.

As I have been saying for over 3 weeks now (from 47 levels), Venezuela will continue to be a risk, if you are an Oil bear. So one needs to “bear” that in mind, no pun intended.

Needless to say, my opinions are just opinions. So if you are using these forecasts as a basis for your trading, make sure you follow the stop levels I keep posting on StockTwits. Happy trading!

New chart:

WTI Aug 8

Yesterday’s chart:

WTI UPDATE Aug 7

Posted in Oil, Uncategorized | Tagged , , , , , | Leave a comment

Top 10 Trading Psychology Myths

How to manage the trading risks & become a successful trader?

I found this article very useful – the Top Ten Trading Psychology Myths (by Dr Gary Dayton)

  1. People are born traders.While it is true that certain personal characteristics make it easier to trade, no one is born a trader. One of the main themes of the Market Wizards books written by Jack Schwager is that almost none of the market wizards was successful from the start. They all worked hard at it.
  2. You have to have a high IQ to trade.Just not true. In some ways, an above average IQ may be a hindrance. Trading is a human performance activity where strong intellectual abilities are unnecessary.
  3. Top traders are successful because they have the “right trading personality.”There is no such thing as the “right trading personality.” Researches have been unable to find a strong correlation between personality type and trading success. It is important, however, to understand your personal characteristics and how they may help and hinder your trading.
  4. Trading is easy.It sure looks that way, doesn’t it? Just draw a few lines on the chart, watch your indicators, and follow the price bars. The truth is that trading is a difficult business to master. It involves different skill sets and abilities from what are needed in most other professions and careers. The trader must understand his or her personal strengths and limitations and develop specific skills to deal with the mental and emotional demands of trading. The later skills are the most difficult to develop and the most overlooked.
  5. You must be tough, hard charging, and fearless to be successful.That’s more media hype than anything else. It glorifies a strong ego, which is a detriment in trading. The most successful traders I know quietly do their research, study the charts, and patiently wait for the right moment. They strive to keep their ego out of their trading.
  6. You must trade without emotions.If you are human, that’s impossible. More importantly, when you understand your emotions you will realize they are assets, not liabilities. The real keys are: 1) to be aware of how your emotions interact with and influence your trading, and 2) to develop the skills needed to trade with them.
  7. Top traders are usually right about the market.Top traders have many, many scratch and losing trades. Top traders are at the top because they exercise good risk control, limit the amount of loss from any given trade, and have developed a psychological edge that allows them to be unfazed by small loosing trades. Most of their trading consists of modest profits and very small losses. When conditions are right, they step up size and let the profitable trades run.
  8. Paper trading is useless-it’s not a real trade without money behind it.If you aren’t paper trading, you are doing yourself a disservice. You should always be paper trading your trading ideas. Why limit your education and experience by the amount of capital you have? Paper trading keeps you sharp; you learn the conditions under which your trading ideas work best. Where else can you get such vital education at so little cost?
  9. Master the technical skills and you will be successful.This is where most traders spend the vast majority of their time, but it’s only part of the picture. You also have to learn important performance skills. Traders should spend as much-if not more-time learning to develop their psychological edge as they do in developing their technical trading edge.
  10. Trading is stressful.It certainly can be stressful, and it certainly is stressful for many. It doesn’t have to be. Successful traders have a certain mind-set. They put little importance on any given trade. Their focus is on the long haul. They know that if they attend to the aspects of trading that are within their control (i.e., trade selection, entry, risk control, and trade management) the profits will take care of themselves.


============================================================================

Many thanks to Dr Gary Dayton, for spelling out these myths!

Did you read that point no. 10 about stress? My Risk Management Program can teach you all about Trading Strategies & Risk Management techniques & help you overcome the stress. If interested, register immediately!

The details of the program can be found here

Posted in Uncategorized | Tagged , , , , | Leave a comment

Risk Management in Forex / Stock trading

Stock markets & Forex markets by their nature, are risky. They can be unkind & treacherous. When you start trading, you start with a disadvantage – be it the broker commission or the bid-ask spread that you see every day eating into your capital. Besides that there is the market risk. So what do successful traders & professional traders focus on as an important trait? It is the Risk Management element – for them, no trade plan or strategy is complete without Risk Management.

Stop losses are a popular way of limiting your risk. But to succeed, one needs to identify & use the right (and reasonable) stop loss levels.  Hedging is another way to manage risk and successful traders always use stop losses or hedging techniques.  While many people know the basic concepts, application of the technique needs further study,

If you are interested in understanding the concept & how to effectively use it to become a successful trader, please click here for an online program on Risk Management. 

Posted in Uncategorized | Tagged , , , , , | Leave a comment

Apple – the juggernaut is unstoppable

We all know what a company AAPL is.  Currently sitting on a cash pile of 260 Billion, Apple has been consistently outperforming itself with great results. And it did it once more with aplomb!

I was planning to short AAPL just ahead of the ER if it went to 155 as it looked top heavy & overbought.  Well luckily, AAPL didn’t go to 155 & I didn’t play that trade. Instead, on a whim, I bought some weekly put-call spreads (145P, 152.50C) 10 minutes before the close yesterday – the puts became worthless overnight but I was able to close the calls today above 159, yielding a 200% return on the total investment.

This juggernaut seems unstoppable. Another lesson for the bears not to play with fire before the ER.  The Apple Boat is nicely going up the stream, weathering all the storms.

AAPL Aug 2

If you want to short it, this may not be the right time unless you want to chase a few pennies. The long term channel just looks beautiful & solid enough for a further rise. Good to wait for the top of the channel and review the technical indicators when it goes above 172+ to see if it makes sense to short at that time. Happy trading!

Posted in Uncategorized | Tagged , , , | Leave a comment