Trading the Risks

We all know that markets carry high uncertainty & risks. Despite that we are all here to win. However, trading is not about being right all the time but about maximizing your wins, cutting your losses & maximizing your overall returns with 3 things –

(a) Adapting a proper trading strategy

(b) Formulating a trade plan that has the right set-up &  an ideal Risk-Reward element

(c) Exercising discipline with Risk Management techniques

If these 3 basic things are taken care of, you can be a winner. I lose 3 out of 10 trades on an average. But when I win, I win big. When I lose, I lose small. But how? Just by adapting a rule based trading system that covers all the three elements listed above.

If you want to learn more about the system I use or about Trading Strategies or about Risk-Managing your trades, please click here 


Posted in Uncategorized | Leave a comment

Top 10 Trading Psychology MYTHS

I found this article very useful – the Top Ten Trading Psychology Myths (by Dr Gary Dayton)

  1. People are born traders. While it is true that certain personal characteristics make it easier to trade, no one is born a trader. One of the main themes of the Market Wizards book written by Jack Schwager is that almost none of the market wizards was successful from the start. They all worked hard at it.
  2. You have to have a high IQ to trade. Just not true. In some ways, an above average IQ may be a hindrance. Trading is a human performance activity where very strong intellectual abilities are unnecessary.
  3. Top traders are successful because they have the “right trading personality.” There is no such thing as the “right trading personality.” Researches have been unable to find a strong correlation between personality type and trading success. It is important, however, to understand your personal characteristics and how they may help and hinder your trading.
  4. Trading is easy. It sure looks that way, doesn’t it? Just draw a few lines on the chart, watch your indicators, and follow the price bars. The truth is that trading is a difficult business to master. It involves different skill sets and abilities from what are needed in most other professions and careers. The trader must understand his or her personal strengths and limitations and develop specific skills to deal with the mental and emotional demands of trading. The later skills are the most difficult to develop and the most overlooked.
  5. You must be tough, hard charging, and fearless to be successful. That’s more media hype than anything else. It glorifies a strong ego, which is a detriment in trading. The most successful traders I know quietly do their research, study the charts, and patiently wait for the right moment. They strive to keep their ego out of their trading.
  6. You must trade without emotions. If you are human, that’s impossible. More importantly, when you understand your emotions you will realize they are assets, not liabilities. The real keys are: 1) to be aware of how your emotions interact with and influence your trading, and 2) to develop the skills needed to trade with them.
  7. Top traders are usually right about the market. Top traders have many, many scratch and losing trades. Top traders are at the top because they exercise good risk control, limit the amount of loss from any given trade, and have developed a psychological edge that allows them to be unfazed by small loosing trades. Most of their trading consists of modest profits and very small losses. When conditions are right, they step up size and let the profitable trades run.
  8. Paper trading is useless-it’s not a real trade without money behind it. If you aren’t paper trading, you are doing yourself a disservice. You should always be paper trading your trading ideas. Why limit your education and experience by the amount of capital you have? Paper trading keeps you sharp; you learn the conditions under which your trading ideas work best. Where else can you get such vital education at so little cost?
  9. Master the technical skills and you will be successful. This is where most traders spend the vast majority of their time, but it’s only part of the picture. You also have to learn important performance skills. Traders should spend as much-if not more-time learning to develop their psychological edge as they do in developing their technical trading edge.
  10. Trading is stressful. It certainly can be stressful, and it certainly is stressful for many. It doesn’t have to be. Successful traders have a certain mind-set. They put little importance on any given trade. Their focus is on the long haul. They know that if they attend to the aspects of trading that are within their control (i.e., trade selection, entry, risk control, and trade management) the profits will take care of themselves.

============================================================================


Posted in charts, Economy, Forex, Gold, stocks, Uncategorized | Tagged , , , , | Leave a comment

Some interesting August charts revisited

Here are a few interesting charts that I had posted on Twitter & StockTwits during early August:

Ripple XRP (Aug 8 chart): And you know where it exactly went!! (below 22 cents)

ChartStorm XRP

Ethereum ETH (Aug 8 chart):  “Expect $100 drop” & ETH dropped 102 to hit a low of 257

ChartStorm ETH.PNG

Bitcoin BTC (Aug 7 chart): Went from 7000 to the “potential 6000” and then bounced. Now waiting to see if it can break above the upper Trend Line Resistance

Chartstorm BTC

Semi-conductors SMH (Aug 7 chart). It is getting close to that trend line Resistance now

ChartStorm SMH

AVGO (Aug 7 chart): Hanging in there. I still have a high conviction on that 160 target

Chartstorm AVGO

TWTR (Aug 8 chart): Bearish as long as it stays below 36.

ChartStorm TWTR

BABA (Aug 8 chart): Did touch the 165-166 support zone as expected and then bounced to 180. Now we can expect another test of 166 if the tariff talks with China end in stalemate.

ChartStorm BABA.PNG

TSLA (Aug 7 chart): Broke above 360 only because of that popular (or notorious?) “Funding Secured” tweet but now it has broken below the 50 WEEK MA and even below $300 (currently down 23% from the post-tweet high of 387).

ChartStorm TSLA

Current forecast for TSLA: Still bearish.. Could test the 265-270 zone very soon (see the Aug 30 chart below) and if the trend line breaks, possibly will go to 220-240 

TSLA Aug 30.PNG


Posted in charts, Economy, stocks, Uncategorized | Tagged , , , , , , , | Leave a comment

Crypto Portfolio Update (as of Sep 1 2018)

Cryptos took a dive in August fueled by doubts if SEC would allow crypto ETFs to become functional. Thankfully, as posted in my July 1 portfolio update, I was determined to manage the risks better this time.. Had a Stop Loss for BTC at 7400, for ETH at 10% and for LTC, XRP and XLM at 20%. All the Stops got triggered except for XLM.

So here is how the portfolio looked like by mid-August, after all those Stop Losses were triggered:

5000 XLM @ 0.20                1,000

Cash                                        13,120

TOTAL                                    14,120          (Original investment was $15,000 in Jan 2018)

My conviction for Aug was that BTC wont go below 5600-5700 in any case. And that one could buy it if it tests below the 6k zone & bounces back above 6300.  Also, Bitcoin Cash (BCH) may be a better buy considering it has more elasticity.

Hence based on the not-so-happy experience with ETH, LTC and XRP, I decided to exclude them from the portfolio and narrow the focus down to just 3 components for the time being: BTC, BCH & XLM.

Patience seemed to have finally paid off as BTC bounced back above 6300 eventually, and my Buy order at 6400 got triggered.  And along with it, the planned BCH Buy order at 520 also got triggered. Meanwhile I also decided to add some more XLM at 22c.

Here is the current status of the portfolio (as of Sep 1, 2018):

Crypto update Sep 1 2018

Now let us wait & see how the month of September plays out for BTC & the other cryptos. Will post some charts in a day or two.

Prior updates:

Click here for the July 29 update

Click here for the July 1 update

Posted in bitcoin, crypto, Economy, Uncategorized | Tagged , , , , , , , , , , , | Leave a comment

Sunday Musings (it is all about parabola)

I am thinking August  & September months are going to be all about major tech stocks and how the parabolic arc pattern plays out for FANG (not FAANG as I am leaving out AAPL for now). While I do think this pattern is going to push NFLX and FB considerably down, I am not so sure about GOOG and AMZN. They also certainly fit the pattern but might not have topped yet in my opinion.

What goes up must come down: Parabolic arc is a reliable reversal pattern but when a stock has gone parabolically bullish, it is extremely hard for any one to predict its top and bid on a reversal. However, once the price breaks below the arc, the stock can typically retrace 50 to 80% of the gains it made on its parabolic run. This pattern is generally rare but currently, especially after the 9 year bull run in the markets, we may be seeing many instances / stocks where this pattern may be playing out.

Before we get into FANG, let us see how this interesting pattern has played out in the past in respect of a few stocks & cryptos.

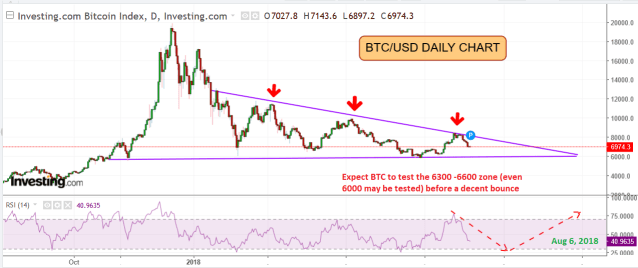
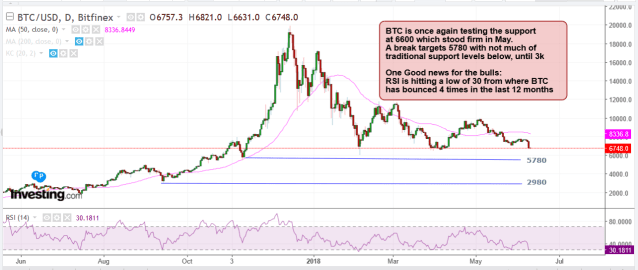
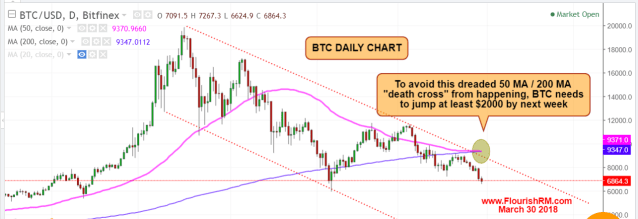
Bitcoin (BTC) – a recent break of the parabolic run after hitting close to 20,000. It dropped 70% from the highs

Parabola BTC

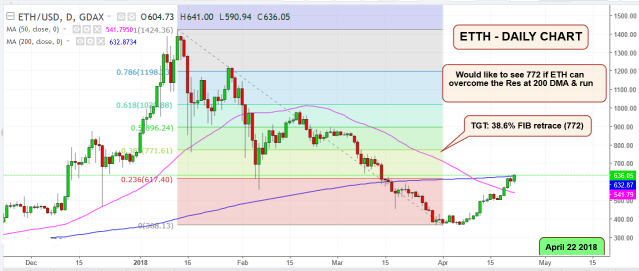
Ethereum (ETH) – a recent break of the arc and a very big reversal. In just under a month, it lost 83% of the gains it made between Dec 2017 & Jan 2018

Parabola ETH.PNG

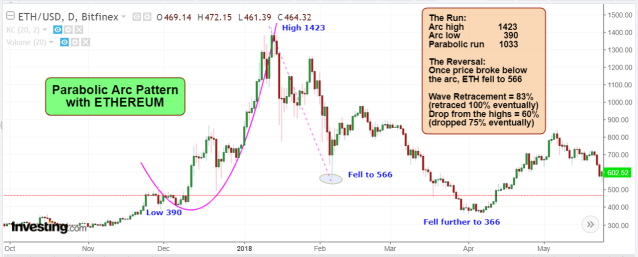
And here is the parabola break forecast I posted on Jan 10, 2018 before that fall in ETH:

Ethereum Jan 10 2018

Nectar Therapeutics (NKTR) – another great example of parabola arc reversal. Retraced 77% of the bullish wave

Parabola NKTR

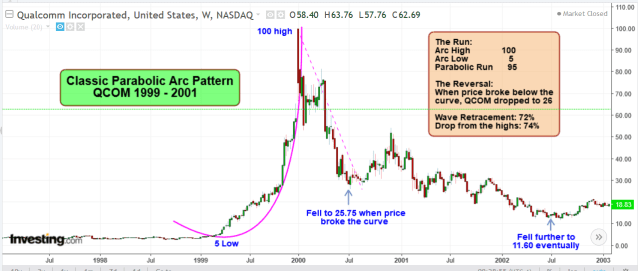
Qualcomm (QCOM) – the 1999-2000 classic parabolic run and bust

parabola QCOM.PNG

That explains it. Parabolic arc patterns are rare but can certainly lead to major reversals, after exhaustion of the run. Now let us see where we are with FANG stocks currently:

NFLX – this is a Forecast chart that I posted before the recent fall in NFLX (on Twitter & StockTwits on 7/13). My forecast was for the price to break below the arc after topping in the 400 – 450 zone. Now that the arc is definitively broken, I am expecting a further drop (retracement of at least 50% of the gains from the parabolic wave).

NFLX July 13.PNG

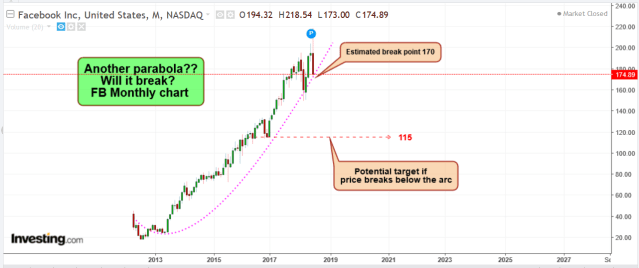
FB – here, the arc is most certainly going to break. A drop below 170 would confirm it. Looking now to test that support at 115 (minimum target) if 168-170 breaks this time.

Parabola FB.PNG

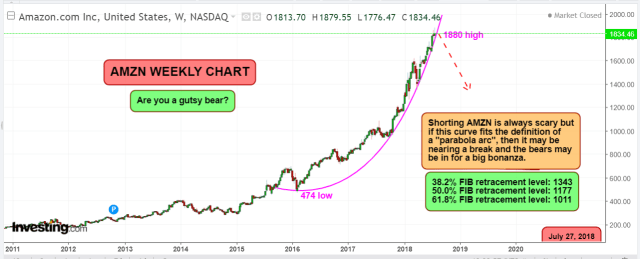
AMZN – this is the toughest one and I am always scared to short AMZN but certainly this fits into the parabolic pattern. It could break the arc around 1775 (OR) it could run a little more, may be to 2100-2200 and then drop to break the arc. At this time, I am not sure if last week’s ER was a good enough catalyst for the break. Gutsy bears are going to win eventually, sooner or later. (I posted this chart on Twitter & StockTwits on 7/27)

AMZN July 27 2018

GOOG – another one, but I think it is not yet ripe for a break. Some more steam may be left before it becomes a victim of the pattern.

Parabola GOOG

SPY – And finally, I have for you, the SPY chart. Tough one again – the reversal might happen right now or after a jump to the 310-320 zone but when it happens, 180 might very well come into the picture.

Parabola SPY.PNG

Let me not say all these reversals are bound to happen but based on the past, I would say these reversals are “very likely”.

So folks, what do you think? Would appreciate your comments.

Happy Trading!


Posted in bitcoin, crypto, Economy, stocks, Uncategorized | Tagged , , , , , , , , , , , , , , , | Leave a comment

Crypto 15k Portfolio Update (July 29)

No changes to the crypto portfolio. All positions remain as they were as of the earlier update. The only change is: Trailed the Stop on BTC to 7400 from 5500.

Hope to see 9900 soon, with 7500 acting as support for now.

Previous update (July 1)


Posted in Uncategorized | Leave a comment

Crypto 15k Portfolio Update (July 1, 2018)

Well, in hindsight, I wish I had NOT decided to “hold” the portfolio undisturbed for 2-3 months or until the price targets were met. I had a Stop Loss only for ETH at 700 (a silver lining) and decided not to risk manage other positions (a big mistake).

All the cryptos in the portfolio followed Bitcoin’s drop and collapsed, wiping away most of the unrealized profits I had as of the last update. The 15k portfolio had grown 45% as of May 5, 2018 but as of July 1, 2018 all the profits have evaporated – see the portfolio status below.

Anyways, I think BTC has bottomed for now around the 5700 – 5800 zone but going forward, I will need to manage the risks in a better way.

BTC chart as posted on June 11, 2018. Subsequently, BTC touched the 5800 level twice between June 21 and June 30 and has now bounced back to the 6300 level. It can again drop back to the 5700 level but I am hoping it won’t

Bitcoin June 11 2018

So, what is happening with the portfolio?

Took advantage of the recent drop in prices and used up the cash left in the portfolio to buy ETH at $435 and additional lots of LTC at $80 and XRP at $0.45c. The current status of the portfolio is as follows:

Crypto update July 1, 2018

Basically, the value of the portfolio is now back to the initial investment figure of 15k. While working with those new targets mentioned above, and feeling confident, I will also make sure to close all the positions if the portfolio value in total falls by 20% any time.

Lesson 1: You will NEVER know, you can NEVER be too sure

Lesson 2: NEVER  say NEVER again 🙂


Posted in bitcoin, crypto, Economy, Uncategorized | Tagged , , , , , , , , , , , , , , , | Leave a comment

Crypto 15k Portfolio Update (May 5, 2018)

Crypto 15k Portfolio – update as of May 5, 2018

First, let us review some latest charts (price forecasts wherever applicable, are for the next 2-4 weeks)

BTC – Still going strong as forecast earlier. Target: 11775. Current price: 9900. Should correct a little at the psychological resistance of 10,000 & then move up again with full speed. I won’t be exiting until the Target Price of 11,775 is hit

Bitcoin May 3 2018

BTC – The earlier chart from April 16 indicated the pressure zone and the next breakout level (9600), Now we are above that zone

Bitcoin Apr 15 2018 (2)

LTCHas topped the earlier forecast TP of 175. New target is 228 – 230 if LTC breaks above 175-180 decisively.

LTC – earlier chart from April with a target of 175 (since met)

Litecoin Apr 16 2018

ETH – Still bullish on the daily chart, though there are indications that bulls might lose a bit of steam soon. While I do expect resistances at 880, ETH could still go parabolic driven by fresh appetite. In any case, I am not selling until it reaches at least 1200..

Ethereum May 3 2018

ETH – earlier forecast from April 22 was targeting 772 (38.2% FIB) as below. Now I am looking at the 61.8% FIB (1024) & 78.6% FIB (1198) as potential targets if 880 is overcome.

Ethereum April 22 2018

XRP – Still looking bullish after that run from 45c level where I was fortunate to add. It might enter a new bull orbit if it breaks above resistance at 1.08. Planning to hold this for now, certainly not selling until it hits $2

XLM – Has had a parabolic rise from 18c to 45c , a growth of 150% in less than a month. I think it needs some pause before it can catch a further bid and run to 65c level. May be I will hold this for further gains and review if and when it hits 75c.

Now let us move on to the portfolio update (as of May 5, 2018). After 3 months of lull period, I think we have started to rock..

No changes to the portfolio in the last 4 weeks.  Status quo from April 2 maintained. I have updated the portfolio with current values as of this morning. I have also included the minimum targets for exit / next rotation of portfolio)

Crypto update May 5 2018

For the prior update (April 16), please click here

Posted in bitcoin, charts, crypto, Economy, Forex, stocks, Uncategorized | Tagged , , , , , , , , , , , , , , , | Leave a comment

Crypto 15k (Apr 15 update)

Crypto 15k Portfolio – update as of April 15, 2018

First, let us review some latest charts (price forecasts wherever applicable, are for the next 2-4 weeks)

BTC – The 6600 level stood firm and the the first breakout above the bearish trend line happened at 8000. But before the next one happens, BTC will face tremendous selling pressure. The second breakout level is at 9600. If BTC doesn’t reverse in the 8600-9600 zone, a break above 9600 should target 12,000 in my opinion.

Bitcoin Apr 15 2018 (2)

LTC – somehow, I feel the 4 Hour chart has been working better in the case of Litecoin, for whatever reason. Looking bullish but faces resistance at the 200 MA (4 HR). If 136 breaks, great potential for 175 in quick time.

Litecoin Apr 16 2018

ETH – bullish on the 4 Hour chart, bearish on the daily chart. So, it is a toss up right now but I expect a run to 560 zone at least before any drop.

Ethereum April 16 2018

XRP & XLM – both are exhibiting patterns that are similar to ETH (bearish on the daily but bullish on the 4 HR). Keeping fingers crossed for now.

Now let us move on to the portfolio update (as of April 15, 2018)

No changes to the portfolio in the last 2 weeks.  Status quo from April 2 maintained, with those 2 buy orders pending (but I do wish & hope we don’t see those prices again). Meanwhile, glad that BTC and other cryptos have gone up from Apr 2 levels.

Portfolio as of Apr 15, 2018  (not planning to sell any of these for the next 2-3 months unless prices go compellingly high)

0.50 BTC at 8400 avg                                 4200  (to add another 1/3 if it drops to 6300)

4000 XRP at 62c avg                                  2480

5000 XLM at 23c avg                                 1150  (to add 5000 if it drops to 12- 15c)

10 LTC at 140 avg                                        1400

8 ETH at 465 avg                                         3720

Cash                                                              2,805

TOTAL                                                         15,755

For the prior update (April 2), please click here

Posted in bitcoin, crypto, Economy, Uncategorized | Tagged , , , , , , , , , | Leave a comment

Recent crypto charts (March 2018)

Here are some very recent charts I published on StockTwits and Twitter on March 30.

BTC Weekly chart (March 30)

Bitcoin March 30 2018

BTC Daily Chart (March 30)

Bitcoin (2) March 30 2018

ETH 4 HOUR Chart (March 30)

Ethereum March 30 2018

ETH (earlier weekly chart from March 15, targeting the 50 WEEK MA)

ETH March 15 2018

Posted in bitcoin, crypto, Economy, Uncategorized | Tagged , , , , | Leave a comment