
RISK MANAGEMENT Training Program – click here
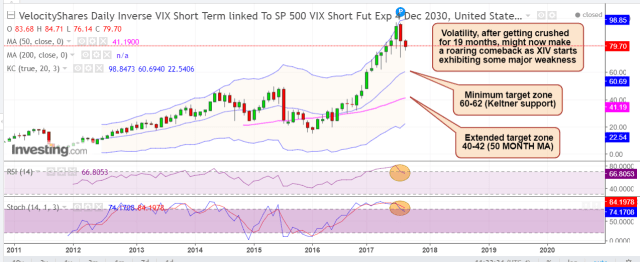
XIV – inverse volatility – is another reason why I am betting on a decent near term correction to the markets. 2016 & 2017 saw volatility getting absolutely crushed whenever it reared its head. However, after that great run, XIV is now exhibiting some real weakness on both long term & short term charts. Besides the positioning of Yen, bonds and other safe haven assets like Gold & Silver, the current status of inverse volatility is signalling that a market correction may be imminent.
XIV Monthly – Based on the signals generated by the monthly chart, I would expect a deep correction to XIV from the current levels. If uncertainties on the geo-political front persist, the critical 50 Month MA might become an extended target.
XIV Daily – Based on the fast as well as slow stochastics on the daily chart and the current positioning of XIV within the Keltner Channel, a potential correction of 20% – 25% for XIV looks highly probable . The 50 day MA at 85.87 should act as a big Resistance for now.

While global markets attempt to rally again due to a boost in risk sentiment (caused this time by some relief on the geo-political front as well as the reduced impact of Hurricane Irma), this may once again prove temporary as worries & tensions could return anytime. More importantly, XIV is positioned for more weakness on the charts and seems to be just waiting for a new catalyst to push volatility up.
Here is the link to the earlier article – Bearish Markets in September?
