Flourish Alerts – New! – Click here
Gold has risen from 1203 to 1340 in a matter of just 2 months. While adverse news (domestic or global) hasn’t generally had much of an impact on the stock markets in 2017, the market’s fancy for Gold has gone up in recent weeks – showing that reasonable fear does exist in the markets. After such a phenomenal run, what is next for Gold? Let us take a look at these charts:
Gold weekly chart – A major long term trend line resistance was broken in August as Gold powered its way above 1270-72. This is extremely bullish for Gold. But now it has to overcome one more TL Resistance from 2010 (drawn in red) in the 1340-42 zone. I think the bulls will continue to push Gold beyond this point and easily reach our target of 1372. Based on the current bullish indicators, I am revising my forecast target for 2017 to 1428 (the earlier target was 1372 which I now expect to be met in Sep).

The link to the earlier article (July 27) on Gold is here
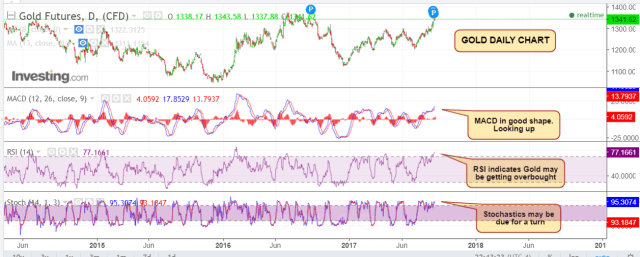
Gold daily chart – However, I do see some possibilities of a reversal before Gold powers its way ahead. This reversal possibility is of course indicated by the daily RSI & stochastics which are nearing overbought levels. The good news for the bulls is that the MACD is still looking up. So any reversal should be temporary and the 1312-1315 zone should act as a strong support in the event Gold reverses.. If Gold doesn’t reverse at 1342, we might soon see 1372 where it may face the next resistance.