Bitcoin’s selling pressure may be gaining momentum. It did bounce at the 50 DMA & then ran to 17,000 but since then, has broken below the 50 DMA once again.
Further to the original post made here on Jan 1 2018, I had published two chart updates for Bitcoin on Twitter & StockTwits, on Jan 3 and Jan 9. For easy reference, I am posting all the 3 charts here:
Original chart from Jan 1 2018. (the full post can be read here)

Chart Update posted on Jan 3
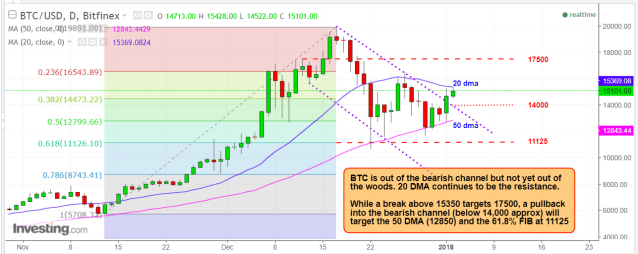
Chart Update posted on Jan 9 (the first target of 12700 was met on Jan 11)

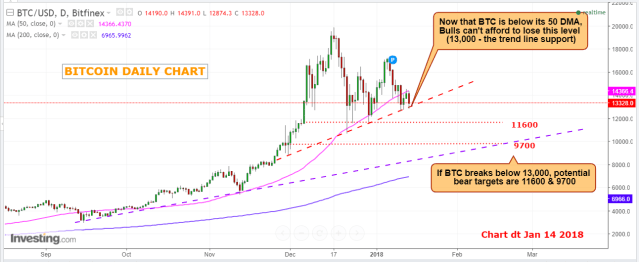
Now here is the latest Update (Jan 14, 2018)
Keeping the fundamentals and the craze for cryptos aside, now that the 50 DMA has been conclusively broken, I expect continued selling pressure on Bitcoin for some time until it finds a floor in Jan / Feb. This is not to say there will be no interim bounces – after all, a daily trading range of 10-20 % is very normal for Bitcoin.
The chart below reflects my current forecast for Bitcoin with targets for Jan & Feb. The bearish targets of course are subject to 13,000 level being broken decisively. (I do not hold any BTC currently but will start buying if it gets to the 9000 – 10000 range)