
WTI met my targets of 62 and 59 from the 64-65 levels. What’s next? Here is an update:
The US output is spiking as projected in my December forecast. It is expected to cross 11 Mbpd sooner than expected (Bloomberg). This will push US to the top slot among oil producing countries, above both Russia & Saudi Arabia.
I see no let up in the US shale production though elsewhere (Middle-East & Venezuela) production could be affected due to tensions & uncertain geo-political situations. The US should be able to make up for most of the production loss in other countries so any constraints on the supply side is unlikely.
What do charts say? The weekly chart is in real bad shape with the MACD & Stochastic RSI pointing to further potential losses. WTI bounced exactly at the 20 week MA and I do not expect it to last long.. May be it can peep into the low 60’s but should resume bearishness soon. (of course any forecast has to have a qualifier and in this case it is going to be “subject to the current mid-east tensions not escalating further”)

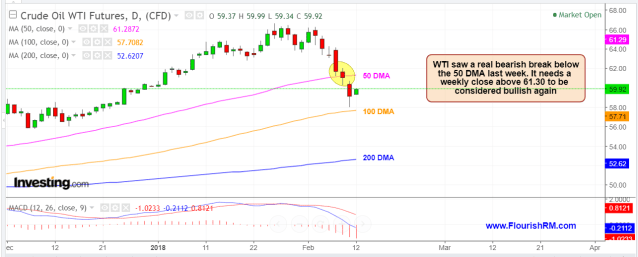
The daily chart is no better though some signs of oversold status may be visible soon. Nevertheless, WTI broke the 50 DMA on Friday and is distinctly bearish unless it sets up a weekly close above 61.30 again
Based on both macro fundamentals and technical factors, I have 80-90% confidence on the forecast which is bearish for the next 8 weeks with the following moving targets:
100 DAY MA (currently at 57.70) 90% probability
200 WEEK MA (currently at 56) 87% probability
200 DAY MA (currently at 52.65) 80% probability
50 WEEK MA (currently at 52.30) 80% probability
Click below for prior forecasts:
WTI – Jan Update (forecasting near term top of 65-66 and potential reversal to 59)
WTI – Dec post (forecasting a run from 56 levels to 60-63 levels before possible reversals)
