
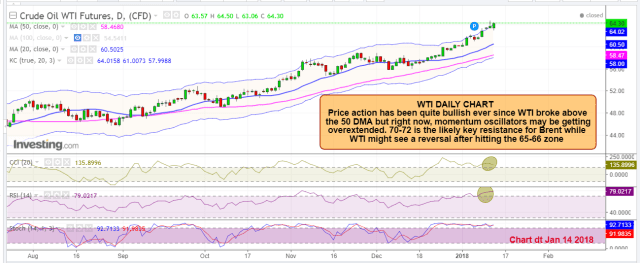
The WTI chart from Jan 14 is below. It indicated WTI was getting extremely overbought. The forecast was for a bearish trend to follow. The key reversal points were identified as Brent 70 -72 and WTI 65-66.
Now the charts are confirming the forecast. WTI hit a peak of 64.90 and subsequently has dropped around 2.5%, below 63.30. I decided to skip the charts this time & rather focus on the results (charts can be boring some times as you know). So here is the update:

The above forecast & targets are for the short term (1 – 5 weeks). One thing that could change the scenario is a supply disruption. If a major disruption happens & the price spikes, the forecast / targets will be invalid. So I would keep a Stop above 66 for the short position
Click here to read the December ’17 post on WTI crude
Click here to subscribe to Flourish Alerts
